We present the first 3-D subsoil image of a lava lake using conductivity imaging.
More information can be found on the scientific article Gailler et al., 2019 published in Journal of Volcanology and Geothermal Research [download pdf]
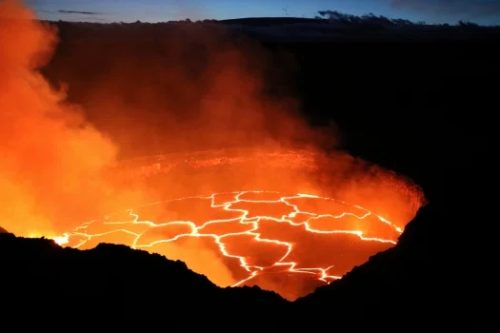
The detection of magma at depth and its quantification remains challenging in volcanology. Active lava lakes are probably the best geological structures to test the ability of geophysical methods for detecting magma. In 2015, we carried out an electrical resistivity tomography (ERT) experiment around Halema‘uma‘u lava lake using multi-electrodes arrays and direct current to probe the lava lake and the extent of its surrounding hydrothermal system (Fig. 1).
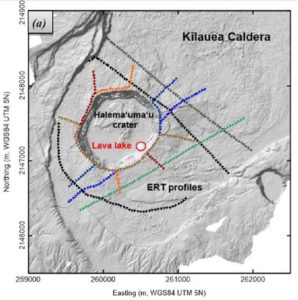
Figure 1: Location of the Electrical Resistivity Tomography (ERT) profiles around the lava lake in Halemaʻumaʻu crater in the summit caldera of Kīlauea Volcano.
Based on the 3D conductivity model (Fig. 2 and Movie 1), we distinguish at least two types of hydrothermal circulations: 1) one guided by the collapse faults of Halema‘uma‘u crater and by the magmatic column of the lava lake, and 2) another guided by previous caldera faults and fractures related to intrusions. We observe that the location of the faults formed during the 2018 collapse of the summit was greatly influenced by the hydrothermally altered zones.
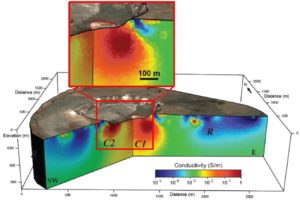
Figure 2: 3D conductivity model of the lava lake and its environment a) at a depth of 50m belowthe lava lake surface. A zoom on the lava lake is framed in red.
Movie 1: W-E animation of the 3D conductivity model
Based on the observations at the surface and the interpretation of the modelled conductivity distribution, an interpretative scheme has been constructed in Fig. 3.
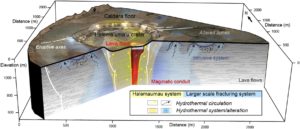
Figure 3: Synthetic interpretative scheme, derived from our 3D conductivity model combined with geological information such as fracturing and zones of alteration