We present the first 3-D subsoil image of the Solfatara volcano revealing its shallow hydrothermal system.
More information can be found on the scientific article Gresse et al., 2017 published in JGR Solid Earth [download pdf]
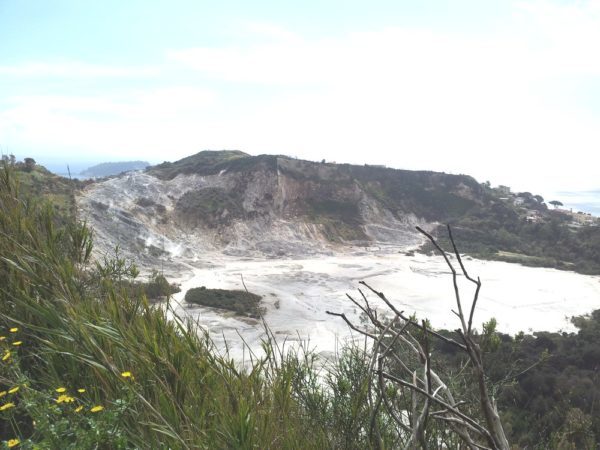
The Campi Flegrei caldera is located in the metropolitan area of Naples (Italy), and it is one of the largest volcanic system on Earth (Fig. 1a). Since 1950, this volcanic complex shows significant unrest, mainly localized beneath the Solfatara crater (Fig. 1b), which accelerated over the last decade (Fig. 1c-f).
Recent studies indicate that the volcanic system is potentially moving toward a critical state, although their authors remain unable to point out when and where a possible eruption could take place. The difficulty of predicting the real volcanic state is here mainly related to the presence of a well-developed hydrothermal system. Indeed, at the Campi Flegrei, it is difficult to separate the magmatic input signal from the hydrothermal response.
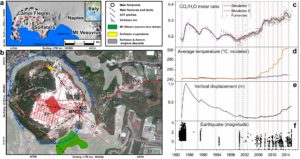 Figure 1. (a-b) Location of the Solfatara volcano in the Campi Flegrei caldera (black and red dotted lines) Main vents are indicated with black circles: Bocca Grande (BG) and Bocca Nuova (BN) fumaroles, the Fangaia mud pool (F), and the Pisciarelli fumarolic area (P). (c) Measured CO2/H2O ratio at Solfatara fumaroles (gray dots) compared with two simulated data. (d) Average temperature modeled of the volcanic system (e) Maximum vertical displacement (m) during 1984–2016. (d) Magnitudes of earthquakes during 1982–2016 (Chiodini et al., 2016).
To help address this concern, we imaged the superficial geological and hydrothermal structure of the Solfatara volcano using 3-D Electrical Resistivity Tomography (Fig. 1). We performed 63 tomograms and obtained a high-resolution 3-D resistivity model by inverting 43,432 measurements using the E4D inversion code (Johnson et al., 2010).
In order to interpret the electrical resistivity model, we provided several surface boundary conditions. We carried out an extensive survey of diffuse CO2 degassing using the Accumulation Chamber Method, and collected 1,136 points. We also acquired a 1-m resolution infrared thermal image.
We evaluated the contribution of surface conductivity with respect to fluid conductivity to separate liquid-dominated structures from clay-rich areas. For this purpose, we have measured soil pH and Cation Exchance Capacity at 27 representative locations. We thus found that electrical resistivity was mainly controlled by fluid conductivity due to extremely acidic soil (pH <2), which prevents the formation of conductive clay minerals at shallow depth.
We identified the 3-D structure of a gas-dominated reservoir at 60 m depth (unit “g”, 20–40 Ω·m, Fig. 2) that feeds the main fumarole Bocca Grande (BG) through a ~10 m thick channel (Movie 1 below). In addition, the electrical resistivity model revealed a channel-like conductive structure (unit “c”, 1–7 Ω·m, Fig. 2), where the liquid produced by steam condensation around the main fumaroles flows within a buried fault down to the Fangaia mud pool (F) area (unit “a”, 1–5 Ω·m, Fig. 2).
We also delineated the emplacement of the main geological structures: ancien lava dome, cryptodome, and tephra deposits (unit ‘e’, 20–50 Ω·m, Fig. 2). The electrical resistivity model also revealed the 3-D anatomy of two liquid-dominated plumes, the Fangaia mud pool (F) and the Pisciarelli fumarole (P), respectively (unit “a” and “p”, 1–5 Ω m, Fig. 2).
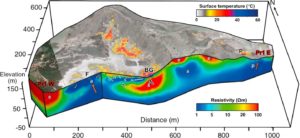 Figure 2. W-E electrical resistivity cross section overlapped with surface temperature image (°C). Surface labels are: the main fumarole Bocca Grande (BG), the Fangaia mud pool (F), and the Pisciarelli fumarolic area (P). Principal resistivity units are: “g” gas-dominated reservoir (20–40 Ω m), “a” and “p” liquid-dominated plume (1–5 Ω m), “c” area of formation and circulation of condensate (1–7 Ω m), and “e” eruptive deposits (20–50 Ω m). Fluid flow are represented by colored arrows: orange = convective plume, black = gas flow, and white = liquid-dominated flow.
Movie 1. 3-D electrical resistivity model of the Solfatara crater (Ω m), draped over a surface temperature (°C) map. The video slices the volcano from W to E and reveals the Fangaia liquid-dominated plume, Mt Olibano, Solfatara crypto-dome, eruptive deposits at the top of the rim, and the resistive gas-dominated reservoir feeding the BG fumarole thought a 10-m tick resistive channel.