We proposed a new multiphysics approach to better image and understand fumaroles in volcanic areas.
More information can be found on the scientific article Gresse et al., 2018
published in Nature Scientific Reports [download pdf]
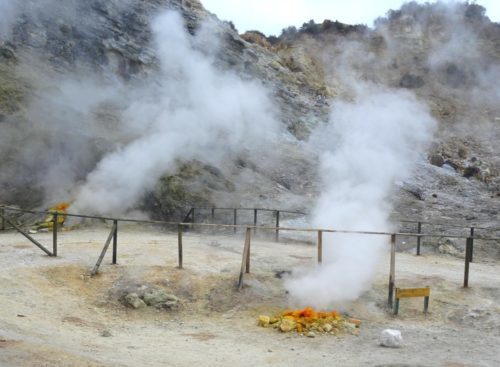
The Solfatara crater is the main degassing area of the Campi Flegrei caldera (Italy) (Fig. 1).
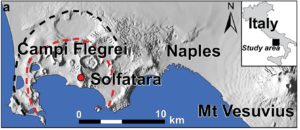 Figure 1. Location of the Solfatara volcano in the Campi Flegrei Caldera (Italy).
In this volcano, two fumaroles named Bocca Nuova and Bocca Grande represent the largest direct degassing vents (Fig. 1a). These two fumaroles ~25 m apart, are regularly monitored because they contain key information to understand the dynamics of the recent unrest (Fig. 2b). Surprisingly, Bocca Nuova and Bocca Grande fumaroles show distinct temporal geochemical signatures over the past 15 years . Indeed, while Bocca Grande fumarole displays an increase in temperature, Bocca Nuova indicates the cooling of the system (Fig. 2c,d).
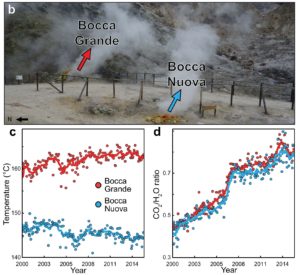 Figure 2. (b) The two main fumaroles at the Campi Flegrei caldera: Bocca Grande and Bocca Nuova with the evolution of (c) temperature (°C) and (d) CO2/H2O mass ratio.
In this study, we aimed to understand the origin of the geochemical distinctions between these neighboring fumaroles. To this end, we first built a high-resolution structural model of the fumarolic system using electric and seismic methods. Our 3-D model delineated the shallow gas reservoir that feeds the main fumaroles, and showed, for the first time, the existence of two distinct channels (Fig. 3 and Movie 1).
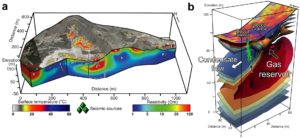 Figure 3. Plumbing system of the fumarolic area inferred from ERT and acoustic noise localization. (a) SW-NE vertical resistivity cross-section overlaid by surface temperature image (°C) crossing the Fangaia pool (F), the Bocca Grande fumarole (BG), and the Pisciarelli area (P) from Gresse, et al.26. Symbols are: g, gasdominated reservoir; p, liquid-dominated plume; c, area of formation and circulation of condensate; e, eruptive deposits; orange arrow, convective plume; black arrow, gas flow; white arrow, liquid-dominated flow. (b) Three dimensional enlargement of the electrical resistivity model beneath the fumarolic area. The gas reservoir feeds Bocca Grande through a ~10-m wide resistive channel. Seismic sources (green triangles) inferred below Bocca Nuova highlight a ~5-m-wide conduit, which channels gases from the gas reservoir toward the surface.
Movie 1: 3-D animation of the fumarolic system, as well as the processing of seismic sources to retrieve the Bocca Nuova conduit.
From these high-resolution images, we used a thermodynamic code (TOUGH2 EOS2, Pruess et al., 1999) to model the multiphase transport of the water and CO2 mixtures, which revealed an hydrothermal interaction with the contamination of Bocca Nuova fumarole by water condensate (Fig. 4).
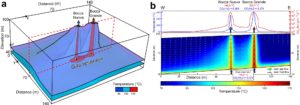 Figure 4. Steady-state temperature distribution model for Bocca Grande and Bocca Nuova. (a) Three temperature isovalues: 80, 100 and 130 °C, represented in blue, purple, and red, respectively. (b) W-E vertical cross-section at y = 70 m, showing the thermal structure of Bocca Grande and Bocca Nuova with surface temperature (°C) and CO2 flux (g m−2 d−1). Green arrows, main gas-flow; white arrows, main liquid flow.
This study clarified a long-discussed debate on the origin of the geochemical distinctions between these twin fumaroles, and provided a better understanding of the geochemical signatures of volcanic gases in general.
Such modeling of fluid interactions will allow for the simulation of dynamic processes of magmatic degassing, which are crucial to better monitor volcanic unrest.